Employment Equity Report 2024-25

Employment Equity Report 2024–25 [PDF XX KB]
ISSN 2563-7088
Copyright/Permission to Reproduce
Contents
- Executive Summary
- I. Introduction
- II. Workforce Representation Analysis
- III. Achievements and Challenges
- IV. Employment Equity Plan 2025–28
- V. Conclusion
- VI. Consultations
- Appendix A: Employment Equity Goals for 2025–2028
Employment Equity Report 2024-25: Executive Summary
This report provides a comprehensive assessment of the Canada Energy Regulator's (CER) employment equity performance for the fiscal year (FY) 2024-25, aligning with the requirements of the Employment Equity Act (EEA). In addition, CER’s unique governance model, featuring required Indigenous representation on key decision-making bodies, strengthens both its equity and reconciliation objectives by embedding First Nations, Métis, and Inuit perspectives within its leadership structure.
Progress and Milestones
The CER continues to demonstrate a strong organizational commitment to employment equity. This year’s report reflects several significant milestones:
- The analysis reveals notable achievements in representation, particularly for Women and Indigenous Peoples, who are exceeding their respective Labour Market Availability (LMA) benchmarks within the CER's workforce. This reflects successful initiatives for designated groups, such as the Indigenous Recruitment, Retention and Advancement Strategy.
- In 2024–25, the CER continued to reduce the gap in representation for visible minorities and people with disabilities. This achievement was made possible through targeted outreach, leadership accountability, and internal mobility support.
- The self-identification response rate remains high at 92.6%, providing robust data for analysis. However, the proportion of employees identifying within certain designated groups remains a challenge, limiting disaggregated analysis for those groups and highlighting the need for continued efforts to encourage self-identification.
2021 Census Benchmark Impact
While CER made continued progress in reducing representation gaps for visible minorities and peoples with disabilities through targeted initiatives, the adoption of 2021 Census benchmarks in 2024–25 led to the re-emergence of some previously closed gaps, highlighting the dynamic nature of LMA and the ongoing need for employment equity sustained effort.
- People with Disabilities: Representation stands at 8.2% compared to a revised LMA of 12.5%, resulting in a gap of approximately 25 employees.
- Visible Minorities: Although there have been improvements in hiring and support for internal career development, visible minorities represent 25.2% of CER’s workforce, below the updated benchmark of 29.0% established by the 2021 Census. This represents a gap of about 24 employees.
These shifts reflect the evolving labour market and a more accurate understanding of workforce representation. The CER’s 2025 Employment Systems Review (ESR) identified that these gaps exist for professional, technical, and senior leadership roles.
A Renewed Employment Equity Plan
In response to these identified gaps and barriers, the CER has developed a forward-looking 2025-28 Employment Equity Plan, with a focus on:
- Increasing workforce representation;
- Improving recruitment and career advancement practices; and
- Promoting inclusion by design in people management practices and processes.
Figure 1 below summarizes employment equity statistics for CER in 2024-25 as of March 31, 2025, that will guide the future looking plan. The plan adopts a data-driven approach to remove barriers, set realistic and measurable targets for increasing workforce representation for visible minorities and people with disabilities, and ensuring continued equity for women and Indigenous Peoples.
Figure 1: CER Workforce Representation vs. Labour Market Availability (LMA) (FY2024–25)
Graphic Description
Long Description of Employment Equity Representation 2024-25 Infographic
Employment Equity Representation
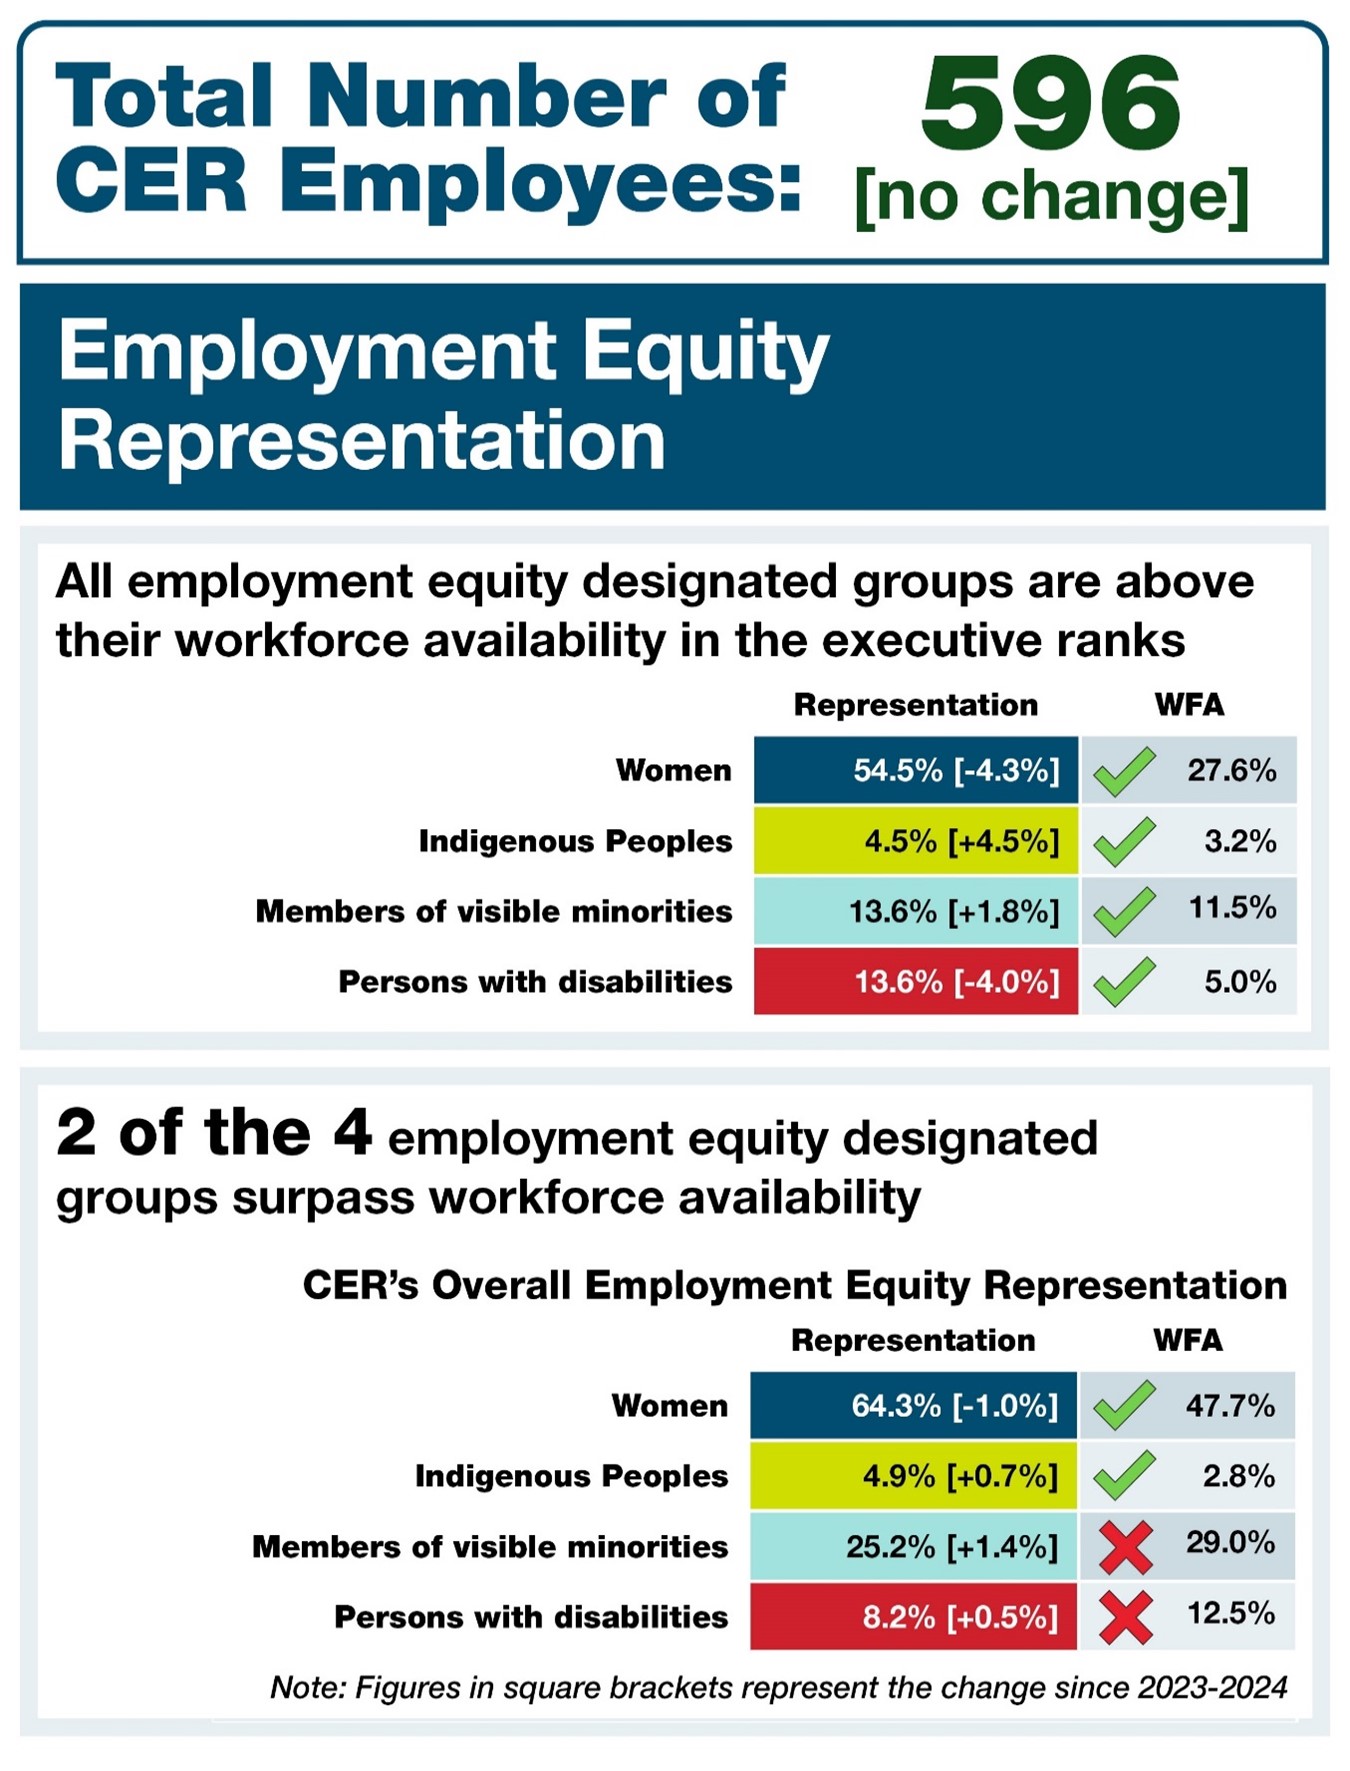
Total Number of CER Employees: 596 [no change from previous year]
Executive Ranks Representation All employment equity designated groups are above their workforce availability (WFA) in the executive ranks.
- Women: 54.5% representation, a decrease of 4.3% from the previous year. WFA is 27.6%.
- Indigenous Peoples: 4.5% representation, an increase of 4.5% from the previous year. WFA is 3.2%.
- Members of visible minorities: 13.6% representation, an increase of 1.8% from the previous year. WFA is 11.5%.
- Persons with disabilities: 13.6% representation, a decrease of 4.0% from the previous year. WFA is 5.0%.
Overall Employment Equity Representation Two of the four employment equity designated groups surpass workforce availability.
- Women: 64.3% representation, a decrease of 1.0% from the previous year. WFA is 47.7%.
- Indigenous Peoples: 4.9% representation, an increase of 0.7% from the previous year. WFA is 2.8%.
- Members of visible minorities: 25.2% representation, an increase of 1.4% from the previous year. WFA is 29.0%. This group is below WFA.
- Persons with disabilities: 8.2% representation, an increase of 0.5% from the previous year. WFA is 12.5%. This group is below WFA.
Salary Distribution and Personnel Flow
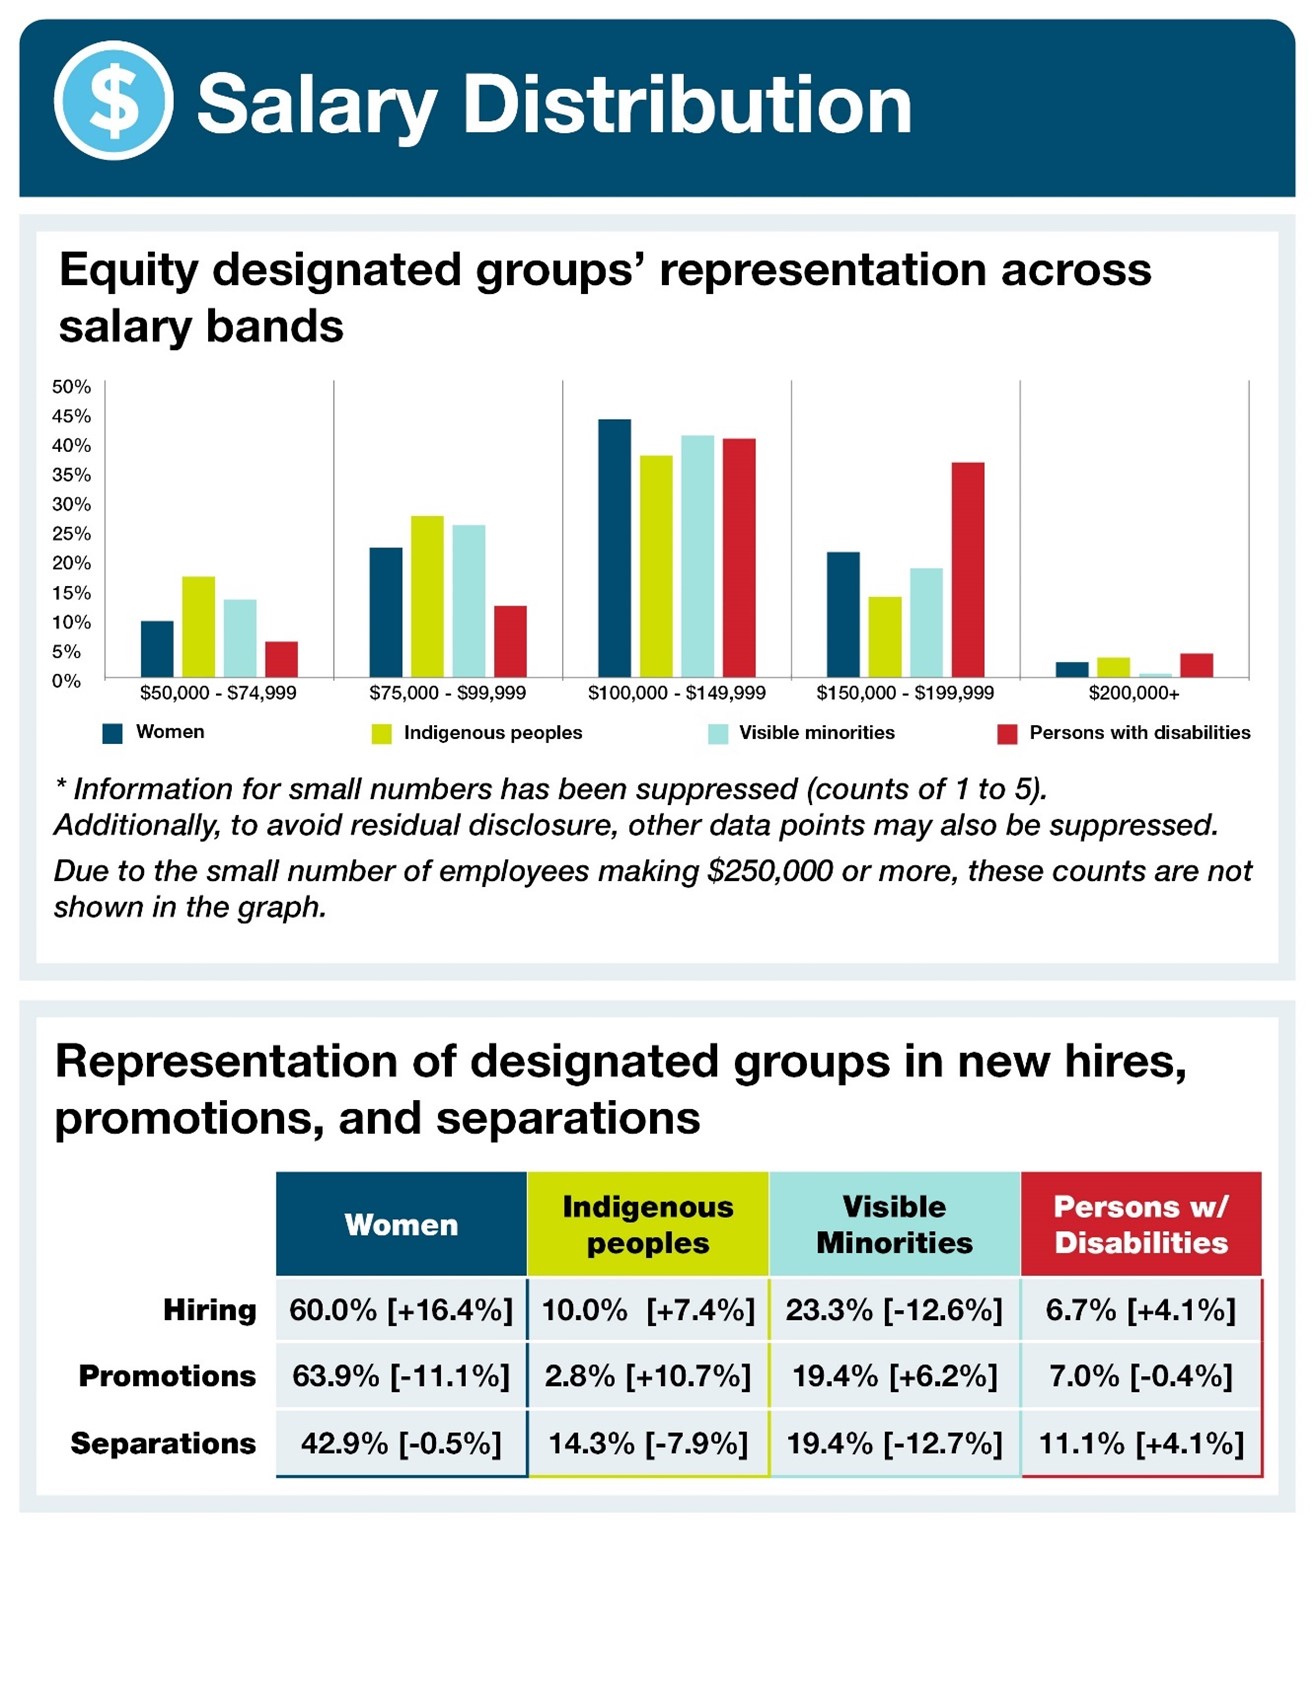
Salary Distribution across Salary Bands The distribution of equity designated groups across five salary bands is as follows. Note that data for counts of 1 to 5 have been suppressed for privacy.
- $50,000 to $74,999: Indigenous peoples have the highest representation in this band at approximately 18%.
- $75,000 to $99,999: Indigenous peoples have the highest representation at approximately 28%.
- $100,000 to $149,999: This is the most populated band for all groups. Women lead at approximately 44%, followed by visible minorities at 42%, persons with disabilities at 41%, and Indigenous peoples at 38%.
- $150,000 to $199,999: Persons with disabilities have the highest representation at approximately 37%.
- $200,000+: All groups show representation below 5%.
Representation of Designated Groups in New Hires, Promotions, and Separations
- Hiring: Figures represent the percentage of total hires for each group and the change from the previous year in brackets.
- Women: 60.0%, an increase of 16.4%.
- Indigenous Peoples: 10.0%, an increase of 7.4%.
- Visible Minorities: 23.3%, a decrease of 12.6%.
- Persons with Disabilities: 6.7%, an increase of 4.1%.
- Promotions: Figures represent the percentage of total promotions for each group and the change from the previous year in brackets.
- Women: 63.9%, a decrease of 11.1%.
- Indigenous Peoples: 2.8%, an increase of 10.7%.
- Visible Minorities: 19.4%, an increase of 6.2%.
- Persons with Disabilities: 7.0%, a decrease of 0.4%.
- Separations: Figures represent the percentage of total separations for each group and the change from the previous year in brackets.
- Women: 42.9%, a decrease of 0.5%.
- Indigenous Peoples: 14.3%, a decrease of 7.9%.
- Visible Minorities: 19.4%, a decrease of 12.7%.
- Persons with Disabilities: 11.1%, an increase of 4.1%.
Source:
- CER Data: MyGCHR, as of March 31, 2025. This data is based on the voluntary self-identification process.
- LMA Data: Statistics Canada, 2021 Census.
- Legend Box: [+10] Increase compared to previous year; [-5%] Decrease compared to previous year.
I. Introduction
Purpose and Scope of the Employment Equity Report
This report fulfills the CER’s annual requirement under the Employment Equity Act (EEA) by providing a transparent, evidence-based assessment of its workforce composition and employment equity progress for the 2024–25 reporting period. It documents CER’s achievements, ongoing gaps, and areas for improvement, and outlines the measures being implemented to ensure a representative workforce and an inclusive workplace.
This year’s reporting includes comparative analysis against the 2021 Census benchmarks, providing an updated view of the representation across the four designated groups under the EEA: Women, Indigenous Peoples, people with disabilities, and members of visible minorities. It also highlights CER’s engagement with impacted employment equity groups, including inviting their input to identify and find collaborative solutions to remove systemic barriers.
Context for the Employment Equity Act and CER’s Commitment
The Employment Equity Act, adopted in 1986, stands as a cornerstone of Canada's legislative framework for achieving workplace equality. Its fundamental purpose is to address historical disadvantages faced by certain groups by encouraging the establishment of working conditions free from barriers, correcting existing disadvantages in employment, and promoting purposeful measures to accommodate differences. The EEA specifically aims to ensure that employment opportunities are not denied for reasons unrelated to ability, and to rectify the disadvantages experienced by women, Indigenous Peoples, people with disabilities, and members of visible minorities. In addition to employment equity efforts, CER’s legally mandated Indigenous governance participation aligns with the United Nations Declaration on the Rights of Indigenous Peoples and supports ongoing reconciliation.
Organizational Overview
As a federal regulator with a mandate that touches communities across Canada, including many historically excluded or marginalized, the CER recognizes that employment equity directly contributes to its overall effectiveness, enhances its credibility with the public, and actively supports reconciliation efforts, particularly with Indigenous Peoples, in alignment with the CER Act and the United Nations Declaration on the Rights of Indigenous Peoples.
Although governance is not a formal component of employment equity reporting, the CER’s governance model ensures Indigenous representation in key decision-making roles. The CER Act mandates Indigenous participation on the Board of Directors, the Commission, and through an Indigenous Advisory Committee composed of representatives from First Nations, Inuit, and Métis communities. This governance framework exemplifies CER’s commitment to reconciliation and inclusion of Indigenous people at the highest organizational levels.
Legislative Framework and Reporting Obligations
Under the Employment Equity Act, federally regulated employers, such as the CER, are legally mandated to submit annual employment equity reports to the Treasury Board of Canada (TBS) by September 30 of each year. These reports are required to provide comprehensive information from the preceding calendar year, detailing the composition of the overall workforce and, specifically, the representation of employees from each of the four designated groups.
Role of Key Federal Bodies
Employment equity in the federal public service is governed by a network of oversight bodies, including:
- Employment and Social Development Canada (ESDC): Oversees the Employment Equity Act, provides tools (e.g., Workplace Equity Information Management System (WEIMS)), and supports employer compliance;
- Canadian Human Rights Commission (CHRC): Audits employers for systemic barriers and ensures equity plans are implemented;
- Office of the Chief Human Resources Officer, (TBS): Manages the public service self-identification database and publishes government-wide equity reports; and
- Public Service Commission (PSC): Promotes equitable staffing, monitors recruitment practices, and reports on equity outcomes.
Methodology
This report is based on internal Human Resources Information System (HRIS) data as of March 31, 2025, and benchmarked against the 2021 Census LMA data provided by Employment and Social Development Canada (ESDC). While LMA is a key legislated benchmark, it's recognized that it reflects existing labor force composition and may not fully account for systemic barriers. Other progressive benchmarks are being explored as part of the ongoing Employment Equity Act review. Self-identification data were extracted from the MyGCHR. For clarity, “self-identification” refers to voluntary disclosure by employees for employment equity purposes, while “self-declaration” typically occurs during staffing processes. The data presented herein reflect both self-identification and self-declaration, to support employment equity analysis. Employment Equity Occupational Groups (EEOGs) follow the classification prescribed by the Treasury Board Secretariat.
This report focuses on the four designated groups as defined by the Employment Equity Act: women, Indigenous Peoples, visible minorities, and persons with disabilities. While other protected groups exist under the Canadian Human Rights Act (e.g., sexual orientation, gender identity, age), they are not included in this legislated reporting framework. Furthermore, this report's analysis does not include intersectional disaggregated data (e.g., Indigenous women, visible minorities with disabilities) due to current data limitations.
Where fewer than three individuals were identified within an employment equity group, data was suppressed to maintain confidentiality. Promotion, hiring, and termination trends reflect fiscal years from 2021–22 through 2024–25, inclusive. Employment equity representation data in tables and figures reflect information as of March 31, 2025, if not otherwise specified.
II. Workforce Representation Analysis
Workforce Demographics and Distribution
As of March 31, 2025, the Canada Energy Regulator’s total workforce comprises 596 employees (Table 1). The CER's operations are primarily based in Alberta, with 581 positions officially designated for this location. To support operational needs and workplace accommodations, our workforce operates under hybrid and remote work agreements. This results in the geographical distribution of our personnel across Canada, with 137 employees working from locations outside of Alberta. Smaller regional presences are maintained through designated worksites in British Columbia (BC) with six positions and Quebec with nine positions. While disaggregated employment equity data is available for Alberta, data suppression policies for groups with three or fewer members apply to BC and Quebec to protect confidentiality, limiting detailed localized analysis in those regions.
| Province | Total | Women | Indigenous Peoples | Visible Minorities | People with Disabilities |
|---|---|---|---|---|---|
| Alberta | 581 | 375 | 29 | 149 | 47 |
| British Columbia | 6 | 4 | - | * | * |
| Quebec | 9 | 4 | - | - | * |
| Total | 596 | 383 | 29 | 150 | 49 |
|
|||||
Employment Equity Representation vs. Labour Market Availability
A core requirement under the Employment Equity Act (EEA) is to assess whether designated groups are equitably represented in the organization compared to their presence in the broader Canadian labour market. This section presents a high-level analysis of the CER’s performance by comparing internal representation against national Labour Market Availability (LMA) benchmarks, derived from the 2021 Census and the 2022 Canadian Survey on Disability. While the CER’s highly specialized workforce leads to recruitment primarily within the technical and regulatory spheres, the national LMA is currently employed to maintain consistency with the Workplace Equity Information Management System (WEIMS) federal system’s reporting.
Table 2 provides a comparative view of FY2023–24 and FY2024–25 representation trends alongside corresponding LMA figures.
| Designated Group | CER (%) FY2023–24*** | LMA (%) FY2023–24* | CER (%) FY2024–25 | LMA (%) FY2024–25** |
|---|---|---|---|---|
| Women | 65.3% | 46.1% | 64.3% | 47.7% |
| Indigenous Peoples | 4.2% | 2.6% | 4.9% | 2.8% |
| Visible Minorities | 23.8% | 23.5% | 25.2% | 29.0% |
| People with Disabilities | 7.7% | 8.7% | 8.2% | 12.5% |
Notes:
|
||||
Table 3 presents a longitudinal workforce representation over the past ten years across the four-employment equity designated groups. The table compares the number of CER employees self-identifying in each group to their estimated LMA each year from FY2014-15 to FY2024–25.
| Year | Women | Indigenous Peoples | Visible Minorities | People with Disabilities | ||||
|---|---|---|---|---|---|---|---|---|
| CER | LMA | CER | LMA | CER | LMA | CER | LMA | |
| FY14–15 | 254 | 222 | 18 | 5 | 60 | 75 | 15 | 19 |
| FY15–16 | 272 | 222 | 19 | 5 | 65 | 75 | 15 | 19 |
| FY16–17 | 309 | 234 | 22 | 8 | 76 | 99 | 26 | 17 |
| FY17–18 | 321 | 234 | 26 | 8 | 57 | 99 | 22 | 17 |
| FY18–19 | 326 | 253 | 25 | 12 | 61 | 111 | 22 | 44 |
| FY19–20 | 334 | 260 | 25 | 14 | 62 | 116 | 21 | 46 |
| FY20–21 | 348 | 255 | 22 | 13 | 69 | 137 | 18 | 47 |
| FY21–22 | 364 | 257 | 20 | 15 | 68 | 129 | 18 | 47 |
| FY22–23 | 387 | 272 | 25 | 15 | 117 | 135 | 35 | 51 |
| FY23–24 | 389 | 275 | 25 | 15 | 142 | 140 | 46 | 52 |
| FY24–25 | 383 | 286 | 29 | 17 | 150 | 174 | 49 | 74 |
| Note: The Labour Market Availability (LMA) values in this table are based on the 2021 Census and apply to the 2024–25 fiscal year. For historical context, LMA values for years prior to 2024–25 were based on the 2016 and 2011 Censuses. | ||||||||
Analysis:
- Women: The CER continues to demonstrate strong and sustained representation of women, with 64.3% of the workforce in FY2024–25, well above the LMA benchmark of 47.7%. While slightly down from 65.3% in FY2023–24, their representation remains strong and consistently exceeds LMA over the years.
- Indigenous Peoples: Representation increased from 4.2% to 4.9%, exceeding the LMA (2.8%) in 2023-24 and 2024-25 years. The positive trajectory over the years reflects the initial success of the Indigenous Recruitment, Retention, and Advancement Strategy (IRRAS), though targeted efforts are still needed in specific occupational groups.
- Visible Minorities: After a long plateau from FY2014-15 to FY2021-22, when visible minority employee counts ranged between 60-68, the CER made significant gains starting in FY2022–23. The number of visible minority employees increased from 117 in FY2022-23 to 150 in FY2024–25. Correspondingly, the proportion of visible minority employees rose from 23.8% to 25.2% over this period. However, this is below the updated 2021 Census LMA benchmark of (29.0%), underscoring the ongoing need for continued outreach, retention, and career advancement efforts.
- People with Disabilities: After stagnating for a period of time (2019 to 2022), the numbers began to rise following successful initiatives such as the self-identification campaign, self-declaration, accessibility events, accommodation process and implementation of the Accessibility Plan, reaching 49 in FY2024–25, an increase from 7.7% to 8.2%. This increase is due primarily to self-disclosure among existing employees rather than an increase in hiring. Nonetheless, a significant gap remains when compared to the LMA of 74.
Representation by Employment Equity Occupational Group
While overall workforce representation gives a high-level view, analyzing by Employment Equity Occupational GroupsFootnote 1 (EEOGs) pinpoints where underrepresentation persists within specific roles. This granular breakdown is crucial for moving beyond aggregate figures to identify embedded systemic barriers that impede equitable career progression and leadership representation. Comparing CER data to 2021 Census benchmarks enables a precise identification of disparities and informs targeted action.
| EEOG (Total Employees) | Women (CER vs. Census) |
Indigenous Peoples (CER vs. Census) |
Visible Minorities (CER vs. Census) |
People with Disabilities (CER vs. Census) |
|---|---|---|---|---|
| 01: Senior Managers (22) | 54.5% vs. 30.4% | 4.5% vs. 3.2% | 13.6% vs. 14.2% (Below LMA) |
13.6% vs. 6.7% |
| 02: Middle Managers (41) | 56.1% vs. 40.3% | 7.3% vs. 2.9% | 17.1% vs. 22.5% (Below LMA) |
9.8% vs. 6.7% |
| 03: Professionals (379) | 62.3% vs. 43.1% | 4.0% vs. 2.4% | 25.1% vs. 31.8% (Below LMA) |
8.2% vs. 12.7% (Below LMA) |
| 04: Semi-Professionals & Technicians (39) | 53.8% vs. 37.9% | 7.7% vs. 2.6% | 15.4% vs. 27.5% (Below LMA) |
10.3% vs. 13.6% (Below LMA) |
| 05: Supervisors (5) | 60.0% vs. 55.3% | 0.0% vs. 4.0% | 0.0% vs. 34.6% | 0.0% vs. 25.0% |
| 07: Administrative & Senior Clerical (52) | 80.8% vs. 80.9% | 5.8% vs. 3.8% | 38.5% vs. 22.7% | 5.8% vs. 15.5% (Below LMA) |
| 10: Clerical Personnel (57) | 80.7% vs. 65.8% | 7.0% vs. 4.4% | 33.3% vs. 27.3% | 7.0% vs. 13.2% (Below LMA) |
| 11: Intermediate Sales and Service Personnel (1) | 0.0% vs. 65.9% | 0.0% vs. 4.7% | 0.0% vs. 31.6% | 0.0% vs. 13.3% |
Notes:
|
||||
Analysis
- Positive Representation: The CER continues to show strong representation of Women and Indigenous Peoples, with both groups largely meeting or exceeding their LMA across most EEOGs. The CER has also surpassed the LMA for people with disabilities in the Middle Manager category (9.8% vs. 6.7% LMA).
- Existing Gaps: Equity representation gaps for visible minorities and people with disabilities remain within the Professional and Semi-Professional & Technicians occupations, roles that are usually the path for career advancement. Additionally, underrepresentation of people with disabilities exists in the Administrative, Senior Clerical, and Clerical categories.
- Visible minorities are underrepresented in the Semi-Professional & Technicians group (15.4% vs. 27.5% LMA).
- People with disabilities are underrepresented in Professionals (8.2% vs. 12.7% LMA), Semi-Professional & Technicians (10.3% vs. 13.6% LMA), Administrative & Senior Clerical (5.8% vs. 15.5% LMA), and Clerical Personnel (7.0% vs. 13.2% LMA).
Disparities identified for equity groups between different EEOGs suggest ongoing systemic barriers affecting both entry and advancement. Addressing these issues will require a focused effort on recruitment, accessible hiring processes, and strategies that support barrier-free career growth and inclusive leadership development within these key occupational groups to achieve meaningful employment equity progress.
Workforce Flow Analysis for Hiring, Promotion, and Retention Trends
To understand movement within the workforce, workforce flow analysis examines the rates at which members of designated groups are hired, promoted, and exit the organization. This dynamic approach allows the CER to identify systemic barriers not visible in static representation data alone.
For the context of this analysis, “Terminations” includes all permanent cessations of employment, such as retirements, resignations, layoffs, and dismissals (i.e., both voluntary and involuntary departures). In all tables and analysis, "departures" and "terminations" are used synonymously.
Future analysis will aim to disaggregate departure data further, particularly for term employees, to better understand reasons for non-renewal or voluntary departures, which are crucial for comprehensive retention strategies.
Hiring Trends by Designated Group
Table 5 summarizes the composition of the 30 new hires at the CER in FY2024–25 by designated group, compared to 2021 LMA benchmarks.
| Designated Group | Number of Hires | % of Hires | LMA (%) |
|---|---|---|---|
| Women | 18 | 60.0% | 47.7% |
| Indigenous Peoples | 3 | 10.0% | 2.8% |
| Visible Minorities | 7 | 23.3% | 29.0% |
| People with Disabilities | * | *% | 12.5% |
| Total | 30 | ||
Notes:
|
|||
Analysis
- Women (18 hires, 60.0%): Robust hiring continues, and overall workforce representation remains well above LMA.
- Indigenous Peoples (3 hires, 10.0%): Exceeds LMA, reflecting sustained outreach and the early impacts of the Indigenous Recruitment, Retention, and Advancement Strategy (IRRAS).
- Visible Minorities (7 hires, 23.3%): Remain below LMA (29.0%) despite an ongoing outreach focus, signaling continued need for targeted recruitment.
- People with Disabilities (*, *%): Hiring remains significantly below LMA, underlining continued challenges in outreach and recruitment of people with disabilities.
Promotion and Termination Trends by Designated Group
Table 6 details promotions (for a total of 36) and terminations (departures) by group in FY2024–25, illustrating varied mobility and retention patterns across groups.
| Designated Group | Promotions (#) | Promotions (%) | Terminations (#) | Terminations (%) | Workforce Representation (%) |
|---|---|---|---|---|---|
| Women | 23 | 63.9% | 6 | 42.9% | 64.3% |
| Indigenous Peoples | * | * | * | *% | 4.9% |
| Visible Minorities | 7 | 19.4% | * | 7.1% | 25.2% |
| People with Disabilities | 4 | 11.1% | 0 | 0.0% | 8.2% |
| Note: An asterisk (*) indicates a suppressed number where fewer than three individuals were involved, according to privacy standards. | |||||
Analysis:
- Women: Promotions for women (63.9%) and terminations (42.9%) are proportional to their workforce representation (64.3%), indicating equity in career advancement and retention.
- Indigenous Peoples: For Indigenous Peoples, promotion data is suppressed due to privacy concerns stemming from small sample sizes. Terminations have a great impact relative to workforce size. This confirms a trend of successful hiring offset by limited upward mobility and possible increased attrition, reinforcing the need for IRRAS initiatives focused on retention and advancement.
- Visible Minorities: Promotions account for 19.4%, which is below their representation (25.2%) and LMA. Although progress has been made, promotion rates have not consistently matched recent hiring surges. The small number of observed terminations suggests strong retention but limited upward movement as compared to last year, as reflected in the Staffing and Non-Partisanship Survey findings of perceived bias in the assessment processes for promotion.
- People with Disabilities: Four promotions (11.1%) exceeded the hiring rate; however, the overall population of employees with disabilities remains limited. No terminations were reported, which aligns with broader trends showing strong retention after hire but ongoing challenges in initial recruitment.
Multi-Year Trend Analysis
To assess longitudinal progress, table 7 presents annual hires, promotions, and departures by group for the past four years.
| Designated Group | Activity | 2021–22 | 2022–23 | 2023–24 | 2024–25 |
|---|---|---|---|---|---|
| Women | Hires | 25 (67.6%) | 30 (63.8%) | 21 (53.8%) | 18 (60.0%) |
| Promotions | 30 (71.4%) | 14 (51.9%) | 21 (75.0%) | 23 (63.9%) | |
| Terminations | 5 (38.5%) | 8 (50.0%) | 9 (64.3%) | 6 (42.9%) | |
| Indigenous Peoples | Hires | 0 (0.0%) | * | * | 3 (10.0%) |
| Promotions | * (<4.8%) | 0 (0.0%) | * | * (*%) | |
| Terminations | * (<7.7%) | * | * | * (14%) | |
| Visible Minorities | Hires | * | 10 (21.3%) | 14 (35.9%) | 7 (23.3%) |
| Promotions | 6 (14.3%) | 7 (25.9%) | 9 (32.1%) | 7 (19.4%) | |
| Terminations | * (<7.7%) | * | 4 (28.6%) | * (7.1%) | |
| People with Disabilities | Hires | 0 (0.0%) | * | * | * (6.7%) |
| Promotions | 0 (0.0%) | * | * | 4 (11.1%) | |
| Terminations | 0 (0.0%) | 0 (0.0%) | 0 (0.0%) | 0 (0.0%) | |
Note:
|
|||||
Analysis:
- Women: Consistently experience proportional or higher mobility (hiring and promotion) compared to their representation, reaffirming equity in progression and retention.
- Indigenous Peoples: Promotions and terminations remain suppressed due to small sample size, indicating ongoing challenges with advancement visibility and/or retention.
- Visible Minorities: Hiring and promotion rates were strong in 2022–23 and 2023–24, occasionally surpassing workforce proportions. In 2024–25, a downturn is noted in both.
- People with Disabilities: Minimal hires or promotions year-to-year and consistently low representation, but strong retention, as no terminations are observed. There is a need to improve initial access and opportunities for upward mobility.
The CER’s workforce trend analysis confirms that while improvements have been made particularly in hiring of Indigenous Peoples and women, promotion and upward mobility for Indigenous Peoples, visible minorities, and people with disabilities remain a challenge. The data suggests that recruitment efforts for some groups are showing results, but a sustained focus on development, promotion, and retention is needed. The strong retention of people with disabilities and women across salary bands is notable. Efforts will continue under the Employment Equity Plan with strategies like the IRRAS to advance, retain, and develop talent across all designated groups.
Remuneration Analysis
Remuneration analysis by designated groups is a critical tool for assessing pay equity and equitable access to senior roles and career advancement opportunities. Disparities in salary distribution often indicate barriers related to promotion, occupational segregation, and underrepresentation in leadership.
This section analyzes the salary range data (table 8) for the Canada Energy Regulator (CER) workforce in FY2024–25, providing insights into compensation equity for women, Indigenous Peoples, visible minorities, and people with disabilities. The analysis follows the Treasury Board of Canada Secretariat guidelines and Employment Equity Act (EEA) reporting requirements to monitor employment conditions for affecting designated groups.
| Salary Range | Women (%) | Indigenous Peoples (%) | Visible Minorities (%) | People with Disabilities (%) |
|---|---|---|---|---|
| $50,000 – $74,999 | 78.7% | 10.6% | 42.6% | 6.4% |
| $75,000 – $99,999 | 76.6% | 7.2% | 35.1% | 5.4% |
| $100,000 – $149,999 | 63.1% | 4.1% | 23.1% | 7.5% |
| $150,000 – $199,999 | 53.6% | 2.6% | 18.3% | 11.8% |
| $200,000+ | 58.8% | 5.9% | 5.9% | 11.8% |
| Total Workforce (%) | 64.3% | 4.9% | 25.2% | 8.2% |
Notes:
|
||||
Analysis:
- Women constitute 64.3% of the workforce and are represented across all salary bands. Their highest concentration is in the two lowest salary ranges (78.7% and 76.6%), gradually tapering in mid to upper salary bands, yet they maintain majority representation in the $200,000+ category. This suggests a strong presence but continued occupational clustering at lower tiers combined with access to senior roles.
- Indigenous employees, representing 4.9% of the workforce, are primarily concentrated in lower salary bands, especially $50,000–$74,999 (10.6%). Representation decreases in the middle salary bands (2.6% at $150,000–$199,999) but rises to 5.9% at $200,000 and above. This distribution highlights the importance of strengthening talent development and advancement opportunities, in alignment with the Indigenous Recruitment, Retention, and Advancement Strategy (IRRAS).
- Visible minorities (25.2% of the workforce) are significantly represented in the lower salary bands, with 42.6% and 35.1% in the two lowest ranges respectively, dropping to just 5.9% in the $200,000+ salary band. This suggests stronger entry-level access but limitations in reaching senior roles, indicating potential occupational segregation and promotion barriers.
- People with disabilities, while their overall representation (8.2%) remains below LMA (12.5%), persons with disabilities are proportionally more represented in higher salary bands, comprising 11.8% in both the $150,000–$199,999 and $200,000+ categories, and are noticeably lower at the lower salary levels. This observation indicates a distinctive profile for this group. Disability is often acquired, diagnosed, or disclosed later in life, meaning some employees may enter CER without initially identifying as disabled. Disclosure may occur later in their career due to changing health prompting accommodation needs or growing psychological safety with tenure.
The remuneration analysis for FY2024–25 reveals that while aggregate representation for some designated groups appears strong, disaggregated salary data exposes persistent inequities in access to higher-earning roles. The concentration of visible minorities in the two lowest salary ranges (42.6% and 35.1%) and a similar trend for Indigenous Peoples reflects occupational segregation and barriers in career advancement. To address these barriers, CER is implementing targeted leadership development programs, formalizing mentorship, and equitable promotion practices to support progression into higher-paying mid-level roles.
The distinct profile for people with disabilities, with higher representation in senior salary bands despite overall underrepresentation, suggests unique challenges primarily at the point of entry and early career mobility. This is further corroborated by the 2023 Staffing and Non-Partisanship Survey (SNPS) data, where 49% of people with disabilities respondents across the Public Service reported experiencing bias or barriers in the staffing process, the highest of any surveyed population and nearly double the CER average (26%). These findings indicate that people with disabilities face obstacles at the point of entry and in promotion and progression opportunities pointing to the need of tailored approaches for each designated group.
Summary of Workforce Analysis
While the CER continues to exceed LMA for Women and Indigenous Peoples, significant representation gaps remain evident for people with disabilities (−25 employees) and visible minorities (−24 employees) particularly in professional, supervisory, and executive roles when compared with data from Workplace Equity Information Management System (WEIMS) data based on the 2021 Census. Career progression remains constrained for several designated groups:
- Visible Minorities: Promotion bottlenecks persist, indicating that visible minorities are not advancing at a rate proportional to their representation.
- People with Disabilities: Underrepresented across nearly all EEOGs and salary bands; low promotion rates reinforce underrepresentation.
- Indigenous Peoples: While hiring is stable and overall representation is strong, promotion and advancement rates suggest hidden barriers in the staffing lifecycle.
While gaps remain in the representation of visible minorities (−24) and people with disabilities (−25), the CER’s proactive employment equity strategy is designed to address these gaps progressively. As a small organization with limited annual hiring volume, gap closure will depend on the timing and frequency of available positions. To address these gaps sustainably, CER will continue to implement inclusive staffing measures, barrier-free recruitment, and targeted outreach while aligning with broader federal workforce renewal efforts.
III. Achievements and Challenges
The 2024–25 Employment Systems Review (ESR), analyzed information and results from the 2023 Staffing and Non-Partisanship Survey (SNPS), the 2024 Public Service Employee Survey (PSES), and current people management practices at the CER. ESR provides a comprehensive analysis of barriers and progress made since 2022 by CER through equity related initiatives.
While the 2023 Staffing and SNPS and 2024 PSES provide invaluable insights into employee perceptions, it is important to acknowledge their limitations. Given the participation rates (e.g., 37% for SNPS in 2023), these surveys may not fully capture the experiences of all employees, particularly those from smaller or more marginalized subgroups. The data should therefore be interpreted as indicative of trends and perceptions, rather than a definitive representation of every individual's experience.
Notable Achievements
The integrated findings from the ESR, SNPS, and PSES highlight several achievements following targeted changes in practices and procedures to address identified barriers:
- Building and ensuring a work environment that is accessible and inclusive for employees with disabilities: Implemented actions from the Accessibility Plan provide better coordination of accommodation and accessibilityFootnote 2 processes through centralized and expert accommodation support, tools for accessible workplace and systems, and integrated equity and accessibility by design into staffing processes (job posters, assessment tools, and onboarding).
- Higher self-identification rates: This indicates growing trust in internal systems.
- Expanded and empowered employee networks: Establishment and revitalization of equity networks, including the Ability and Barrier Circle, Indigenous Employee Circle, Equity Network, and Black Employee Network, offered employees a forum to raise concerns and collaborate in providing solutions to improve people management practices and processes.
- Growing confidence in internal systems and programs: Modernized hiring practices, including standardizing diverse selection boards, improving accommodation practices, and expanding targeted outreach to racialized, Indigenous, and disability communities allowed for increased representation were previous gaps existed, such as for visible minorities group.
- Leadership accountability in advancing CER’s commitment to diversity, equity, and inclusion: Increased collaboration with designated Executive Champions and other organizational citizenship leaders and including equity, accessibility, and inclusion accountability in leadership accountabilities led to improved leadership ownership and adoption of inclusive people management practices.
Measured Progress:
The analysis below provides organization-level insight into actions supporting CER’s equity objectives and is limited to the 2024 PSES questions related to diversity, inclusion, duty to accommodate, psychological safety, and equity. Where available, the results are compared to the Public Service benchmark.
In summary, PSES results indicate strong performance in diversity support, values and ethics, and accommodation experience, coupled with targeted areas for improvement in psychological safety around racism, complaint handling, and perceived promotion opportunities. These findings align with the Workforce Analysis and SNPS results.
- Diversity, Inclusion and Anti‑Racism: Between 69% and 82% of CER employees have positive views on diversity and anti-racism initiatives. At the same time, results show only 64-69% of employees feel safe to speak about racism without fear of reprisal, and 15% report discrimination in the past 12 months (up from 13% in 2022).
- Promotion and Career Development: While immediate-supervisor support remains positive (76% of employees feel their supervisor supports their career goals, up from 71% in 2022), perceptions of promotion opportunities and career-development support show room for improvement. Only 54% of employees agree that the CER supports their career development, which is unchanged from 2022 and slightly below the Public Service average of 55%. Furthermore, only 42% believe they have opportunities for promotion, a slight increase from 41% in 2022.
- Respectful Workplace and Psychological Health: Perceptions of respectful behaviours remain largely positive, though they declined slightly relative to 2022. For context, at CER 82% feel respected, 74% would recommend CER as a workplace, 65% describe CER as psychologically healthy.
- Duty to Accommodate & Accessibility: Employees reported high comfort requesting accommodation from their supervisor (81%) and high satisfaction with implemented measures (84%), with results at or above Public Service comparators. These results are consistent with actions under the Accessibility Plan and the centralization of accommodation support.
Current Challenges:
CER’s efforts since 2022 have created a strong foundation for a workplace environment where employees feel respected, valued, and secure in expressing their cultural identities without fear of discrimination or bias, but structural challenges persist in promoting equity, cultural safety, and leadership accountability.
The integrated findings from the ESR, SNPS, and PSES highlighted current challenges:
- Representation gaps and promotion inequities and advancement bottlenecks for visible minorities and people with disabilities stem from embedded structural barriers in staffing, assessment, and development pathways indicating targeted actions to standardize promotion criteria and strengthen leadership development pathways for designated groups.
- Perceptions of bias and exclusion remain most acute among racialized, disabled, and gender-diverse employees. Bias in hiring process was most frequently reported at the organizational screening stage (62%), followed by interviews (50%) and written exams (23%), particularly among visible minorities, people with disabilities, and those identifying as another gender. Only 47% of CER respondents felt staffing processes effectively reduced or eliminated barriers for designated groups.
- Employees reported concerns about favoritism, informal networks, limited targeted outreach, and the impact of bilingual imperative requirements on advancement opportunities for leadership roles. Informal input from employees and Union highlighted concerns regarding disproportionate challenges faced by Black employees and people with disabilities in career advancement and pay equity, indicating the need for disaggregated analysis and targeted interventions for specific racialized subgroups.
- The lower comfort in raising racism‑related concerns and lower satisfaction with complaint handling, indicating continued work is required to strengthen psychological safety and trust in reporting mechanisms.
These highlighted challenges indicate continual efforts are needed to actively address power imbalances, systemic barriers, and foster mutual respect across diverse cultural backgrounds to promote inclusivity and equity and directly inform the barrier‑removal measures in the Employment Equity Plan 2025–28.
IV. Employment Equity Plan 2025–28
The Canada Energy Regulator's 2025-28 Employment Equity Plan represents a strategic and data-informed evolution of its commitment to building a representative, inclusive, and barrier-free workplace. This plan is built upon findings from the Employment Systems Review (ESR); learnings from the implementation of the Diversity and Belonging Roadmap, Accessibility Plan, and the Indigenous Recruitment, Retention, and Advancement Strategy (IRRAS); and is aligned with national legislative and policy frameworks including the Employment Equity Act (EEA), the Accessible Canada Act (ACA), and the Clerk’s Call to Action on Anti-Racism, Equity, and Inclusion.
It outlines a comprehensive roadmap to build a more inclusive and representative workplace where all employees, irrespective of their race, ethnicity, gender, disability, or other identities, feel respected, valued, and empowered to succeed. The plan commits to continuous improvement, recognizing that equity and inclusion are enablers that enhance organizational performance and culture, build public trust and confidence, and advance our reconciliation efforts.
Looking Forward
The CER will continue to advance its employment equity objectives through a series of key actions:
- Increase workforce representation: Our top priority is to increase representation in areas with identified gaps when the positions are available. The plan will:
- Prioritize external recruitment processes where employment equity gaps are identified, with specific goals and targets outlined in Appendix A.
- Implement the Government of Canada’s modernized self-identification tool and campaign upon availability.
- Expand targeted outreach to Indigenous organizations, disability-serving agencies (e.g., CNIB and career fairs), and racialized communities, and leverage Public Service Commission (PSC) inventories and programs (e.g., Federal Internship for Canadians with Disabilities, Indigenous Student Employment Program, Digital Careers).
- Create annual business unit staffing plans to align with our hiring goals.
- Improving recruitment and career advancement practices: We will continue to reduce bias in hiring practices and to embed a fair and equitable approach into all staffing processes:
- Standardize diverse selection boards.
- Continue building on our successful student hiring and bridging program.
- Explore opportunities for workforce analysis using WEIMS and internal HR data, disaggregated by employment equity occupational group, salary band, and location, with consideration to intersectionality factors, to be used to guide equity-responsive HR plan and programs.
- Promoting inclusion by design in people management practices and processes: We will continue to foster a culture of inclusion through the following initiatives:
- Continue training and support for leaders and employees on aspects related to equity and inclusion, such as understanding bias and barriers, creating and maintaining a psychologically safe work environment, and preventing harassment and discrimination.
- Implement the Government of Canada Workplace Accessibility Passport and implement a centralized process for accommodation requests.
- Continue to support career development initiatives, including mentorship, job shadowing, and equitable access to programs such as the Mosaic Leadership and executive developmental pools.
- Continue to embed equity, diversity, inclusion, and accessibility lens into policy and program design to advance cultural change.
- Develop a structured approach to succession planning.
Measuring Progress
The CER will implement measures of success focusing on both representation and inclusion outcomes. Representation targets utilize 2021 Census Workforce Availability as the minimum benchmark and take into consideration the available positions at the CER. Inclusion will be measured through a combination of qualitative and quantitative data from various sources (e.g., PSES, NSPS, internal surveys, etc.).
Governance and Adaptation
The 2025–28 Employment Equity Plan is designed as a living document, subject to annual reviews and adjustments based on updated workforce data, employee feedback, and relevant analysis. A formal mid-term review, scheduled for 2027, will assess the plan's trajectory and determine if corrective actions are necessary. This adaptive approach ensures the CER remains responsive to evolving needs and challenges in its pursuit of employment equity.
V. Conclusion
The Canada Energy Regulator’s Employment Equity Report for FY2024–25 presents a comprehensive and evidence-based account of an organization actively advancing its equity, diversity, inclusion, and accessibility agenda, showing notable progress with women’s representation reaching 64.3% and Indigenous Peoples' representation at 4.9%. The CER continues to demonstrate strong and sustained representation of women and Indigenous Peoples, consistently exceeding Labour Market Availability benchmarks and highlighting leadership in these areas.
However, the report also highlights underrepresentation of visible minorities (-24) and people with disabilities (-25), particularly within professional, supervisory, and leadership roles. Findings from the Employment Systems Review and recent employee surveys reveal perceptions of systemic barriers embedded within staffing and promotion processes. For example, remuneration analysis highlights that visible minorities and Indigenous Peoples remain disproportionately concentrated in lower salary bands, suggesting structural challenges in career mobility. While this report draws on multiple data sources including workforce statistics, employee surveys, and qualitative findings from the Employment Systems Review, it is important to note that survey participation rates may not fully capture all employee experiences. These findings should be interpreted as indicative of workplace trends and perceptions, reinforcing the importance of ongoing dialogue through employee networks and direct consultation
In response, the CER has developed a forward-looking 2025–28 Employment Equity Plan. The plan focuses on increasing workforce representation, enhancing recruitment and career advancement practices, and embedding inclusion as a default in people management processes. Initiatives such as the Indigenous Recruitment, Retention, and Advancement Strategy, and the Accessibility Plan will underpin these efforts.
Looking ahead, the CER’s commitment to transparency, adaptive governance, and periodic progress reviews positions it well to continue closing representation gaps and cultivating an inclusive, high-performing workforce that reflects and serves Canada’s diverse population.
VI. Consultations
The CER's approach to employment equity is one of ongoing collaboration, extending beyond the formal review of this annual report. Throughout the reporting period, we engaged in a multi-faceted and ongoing dialogue with employees and their representatives.
This consultation process was designed to be both formal and informal, ensuring a variety of perspectives were heard and considered. It included:
- Engagement: Discussions and informal meetings with employees from all designated groups, including the Ability and Barriers Circle, the Indigenous Employee Circle, the Black Employee Network, the Equity Network, and Union representatives, to understand their lived experiences, challenges, and successes.
- Focus Groups and Panel Discussions: Structured sessions with members of the Indigenous Employee Circle, the Ability and Barriers Circle the Black Employee Network, and other designated groups to discuss specific issues such as recruitment barriers, career development, and workplace inclusion. These forums provided a space for in-depth, candid feedback.
- Targeted Feedback on the Report: The formal review process where this report was shared with the Ability and Barriers Circle, the Indigenous Employee Circle, the Black Employee Network, the Equity Network, and Union representatives for their direct input. This was a critical step to ensure the data and narrative accurately reflected key issues and trends.
Appendix A: Employment Equity Goals for 2025-2028
The numerical goals outlined in this annex reflect current representation gaps as measured against Labour Market Availability (LMA) benchmarks from the 2021 Census through Workplace Equity Information Management System (WEIMS) and aligned with Treasury Board Secretariat methodologies. These figures guide CER’s proactive workforce planning and should be interpreted within the context of a small organization with limited annual staffing volume in terms of opportunities for hiring and promotions.
Gaps for visible minorities (−24) and people with disabilities (−25) are recognized as significant. However, given that CER has fewer than six hundred employees, it is important to emphasize that these gaps may not be fully closed within a three-year window. Instead, they will be addressed progressively, as vacancies arise, through targeted outreach, inclusive hiring, and barrier removal strategies.
For women and Indigenous Peoples, CER exceeds national LMA benchmarks. Goals for these groups are focused on sustaining representation, improving advancement opportunities, and addressing pay band distribution inequities identified in the remuneration analysis.
The occupational group goals presented here are not rigid quotas but directional guides to inform inclusive staffing strategies aligned with CER’s strategic workforce planning priorities.
| Table 1A – Women | GAP | 3 Year Recruitment Goals 2025-2027 | ||
|---|---|---|---|---|
| Occupational Group, Gap and Position(s) Total gap: No overall gap* |
2025–26 | 2026–27 | 2027–28 | |
Semi‑Professionals and Technicians
|
2 | 1 | ||
Administrative and Senior Clerical Personnel
|
4 | 1 | ||
Clerical Personnel
|
1 | 1 | ||
| Table 1B – Indigenous People | GAP | 3 Year Recruitment Goals 2025–2027 | ||
|---|---|---|---|---|
|
Occupational Group Gap and Position(s) Total Gap: No OVERALL Gap* |
2025–26 | 2026–27 | 2027–28 | |
Professionals
|
1 | 1 | ||
Administrative and Senior Clerical Personnel
|
1 | 1 | ||
| Table 1C – Visible Minorities | GAP | 3 Year Recruitment Goals 2025–2027 | ||
|---|---|---|---|---|
|
Occupational Group Gap and Position(s) Total Gap: 24 |
2025–26 | 2026–27 | 2027–28 | |
Middle and Other Managers
|
3 | 1 | 1 | |
Professionals
|
37 | 5 | 5 | 5 |
Semi‑Professionals and Technicians
|
6 | 1 | 2 | |
Supervisors
|
1 | 1 | ||
Administrative and Senior Clerical Personnel
|
1 | 1 | ||
Clerical Personnel
|
1 | 1 | ||
| Table 1D – People with Disabilities | GAP | 3 Year Recruitment Goals 2025–2027 | ||
|---|---|---|---|---|
|
Occupational Group Gap and Position(s) Total gaps: 25 |
2025–26 | 2026–27 | 2027–28 | |
| Professionals | 17 | 5 | 5 | 5 |
| Semi‑Professionals and Technicians | 1 | |||
| Supervisors | 1 | 1 | ||
| Administrative and Senior Clerical Personnel | 5 | 1 | 2 | 2 |
| Clerical Personnel | 4 | 1 | 2 | 1 |
Notes:
|
||||
- Date modified: